The project covers ten counties: Elgeyo Marakwet, Trans Nzoia, West Pokot, Baringo, Nakuru, Nandi, Bomet, Kericho, Uasin Gishu, and Narok. For scenario analysis, these counties are grouped into four regions:
TVA 1: West Pokot, Elgeyo Marakwet, Trans Nzoia
TVA 2A: Kericho, Nandi, Nakuru, Baringo
TVA 2B: Bomet, Narok
TVA 3: Loita
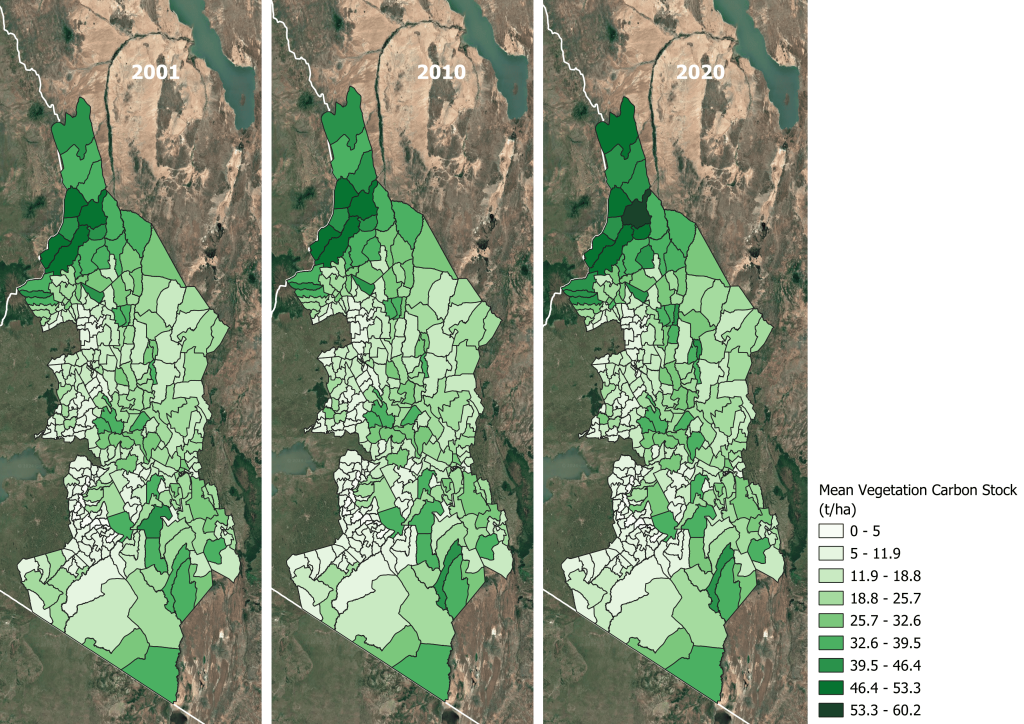
Biomass
Dark-green regions correspond to higher levels of carbon storage, implying that these areas contain denser or more abundant vegetation
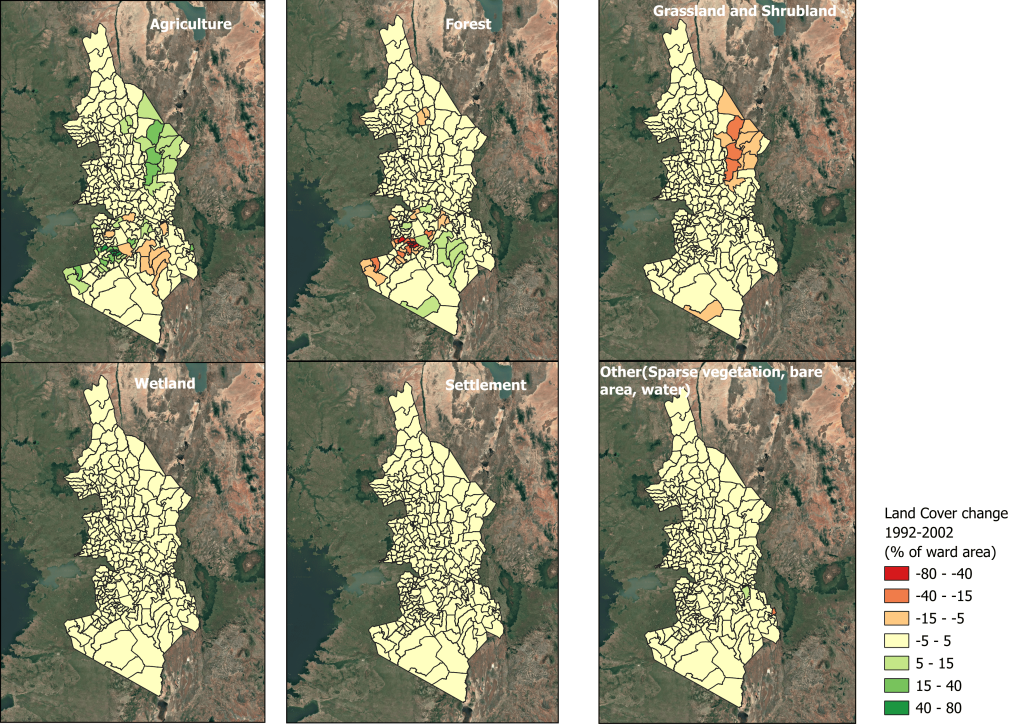
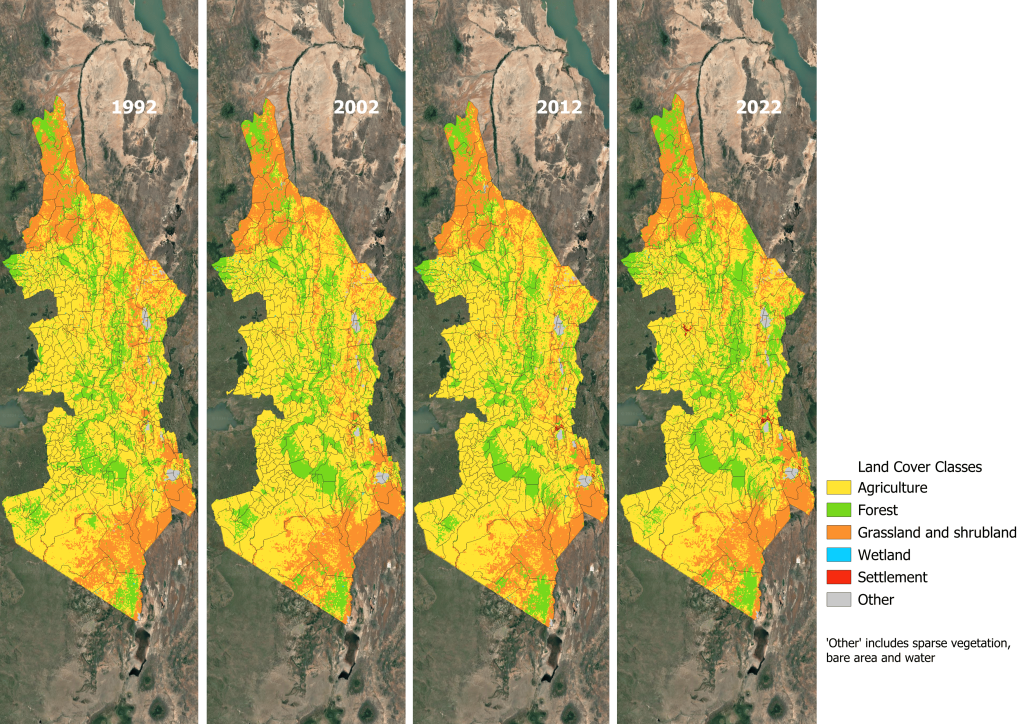
Land Cover Change 1992 to 2002
Red and orange shading highlights wards where the mapped land-cover category decreased, while green shading identifies areas with an increase. For instance, between 1992 and 2002, Agricultural land cover expanded across many wards, while Forest and Grassland/Shrubland cover types contracted.
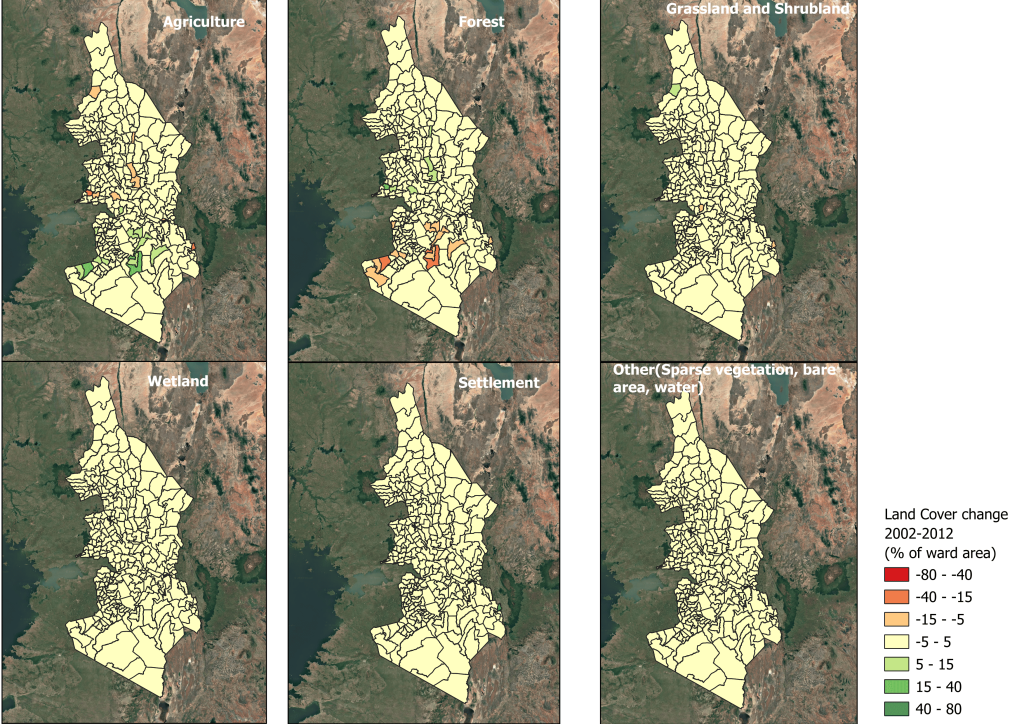
Land Cover Change 2002 to 2012
Between 2002 and 2012, overall ward patterns changed little, but a few wards displayed minor growth in Agricultural land and a slight reduction in Forest cover.
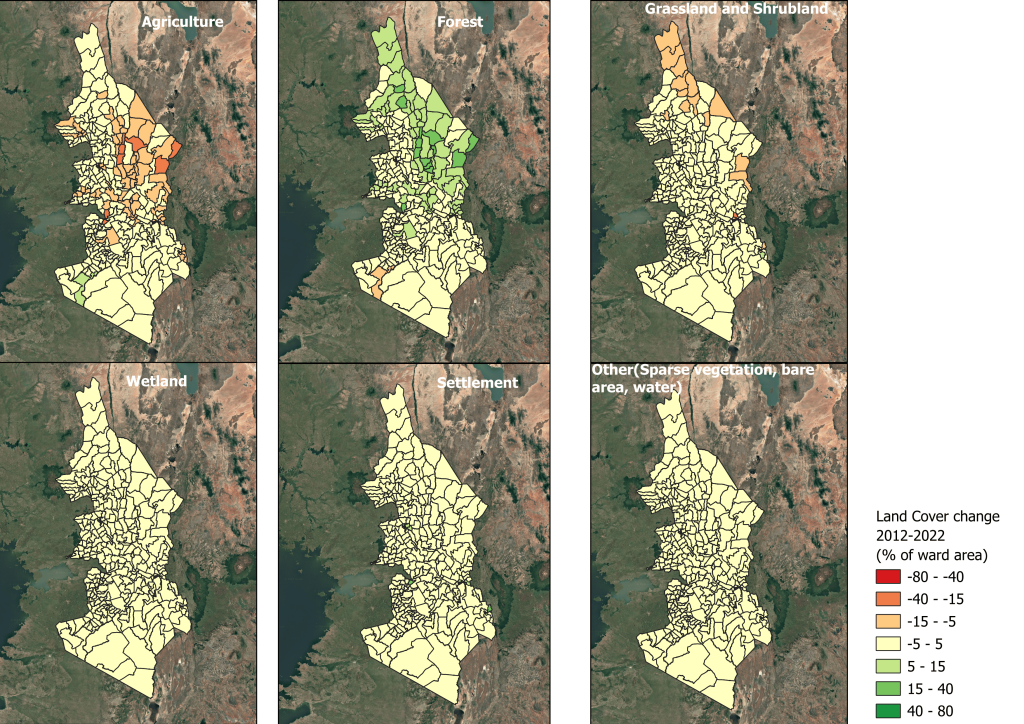
Land Cover Change 2012 to 2022
Between 2012 and 2022, a number of wards saw marked declines in agriculture and grassland/shrubland, while forested areas expanded across much of the landscape.
Land Cover
The map illustrates the distribution of land cover across TVA wards from 1992 to 2002. TVA 1 is primarily covered by Grassland and Shrubland, with smaller patches of agriculture and forest, including the Cherengany Hills Forest. TVA 2 has remained largely agricultural, supported by surrounding forests, such as the Mau Forest. TVA 3 has consistently displayed a blend of Agriculture, Grassland/Shrubland, and limited Forest areas.
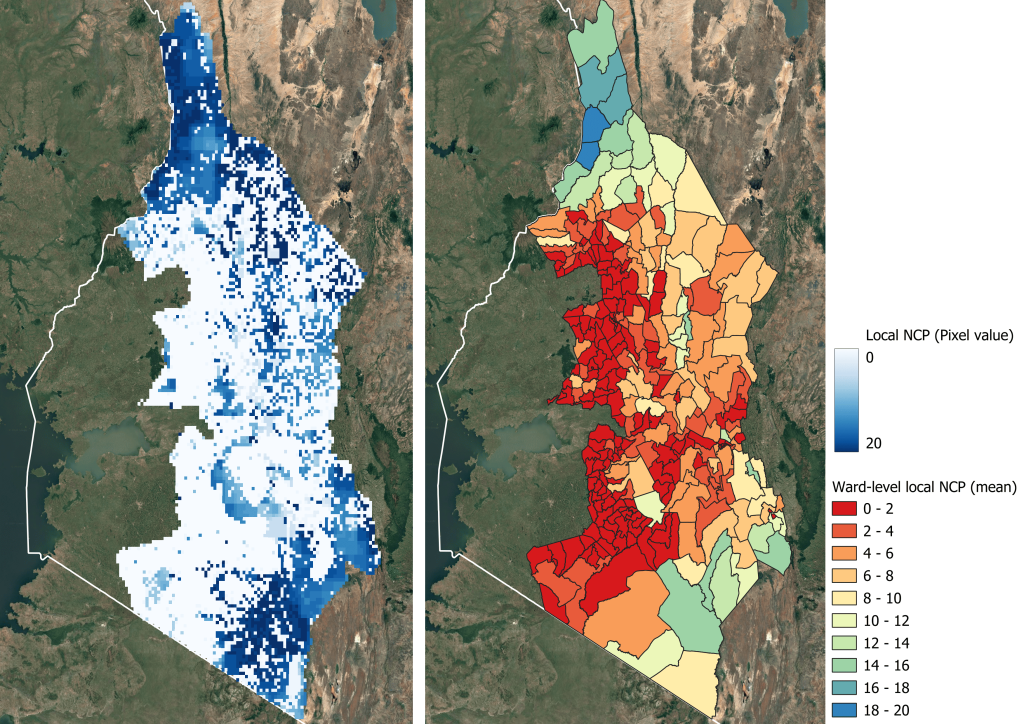
Nature’s Contribution to people
Blue-shaded areas highlight places where nature delivers the most significant benefits to communities—for example, water, food, clean air, timber, and fodder.
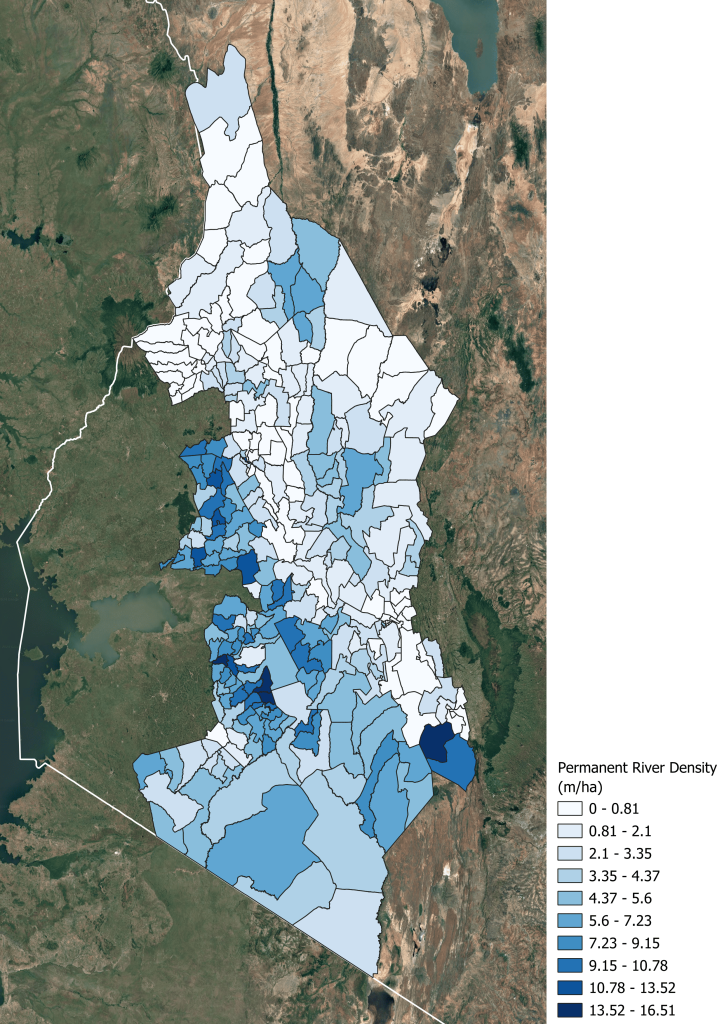
Permanent River Density
Areas shown in blue highlight places where rivers and streams are more abundant, in contrast to the sparser water networks found in the white areas.
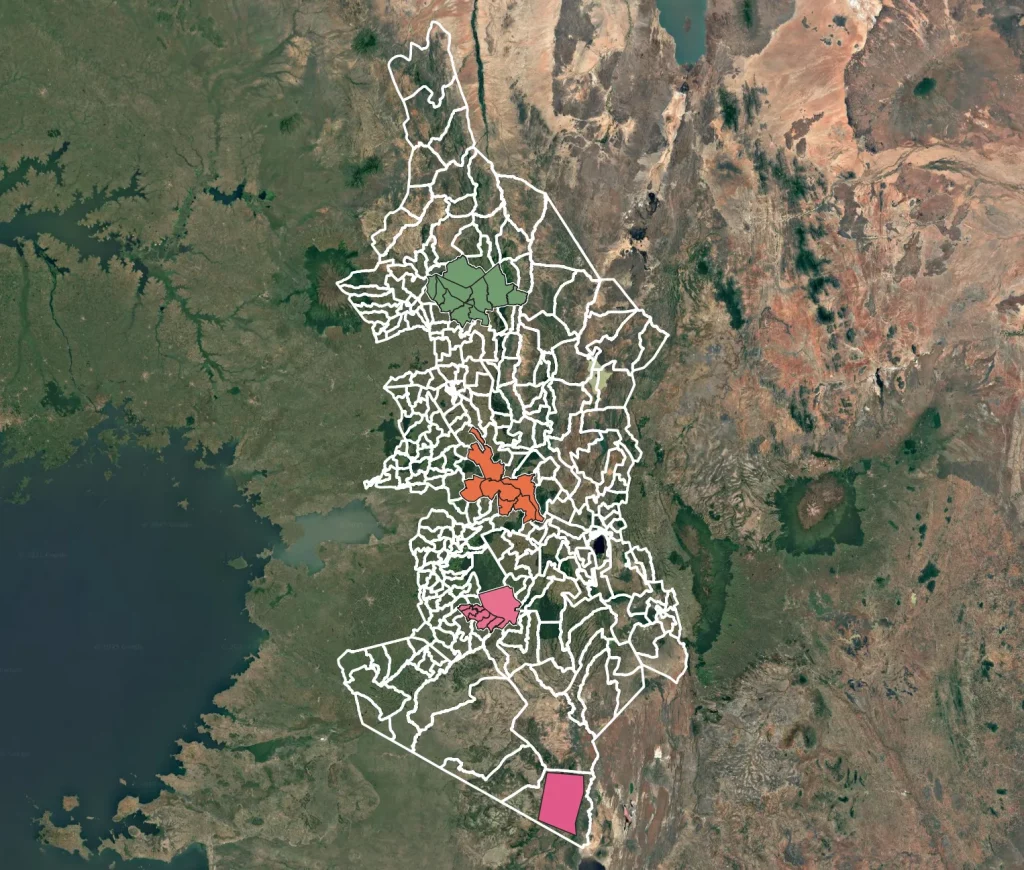
Land Ranger Areas
White-outlined Landranger Areas define the specific zones where the authority manages land-use and resources—such as water catchments, agricultural projects, and infrastructure—to support local communities.
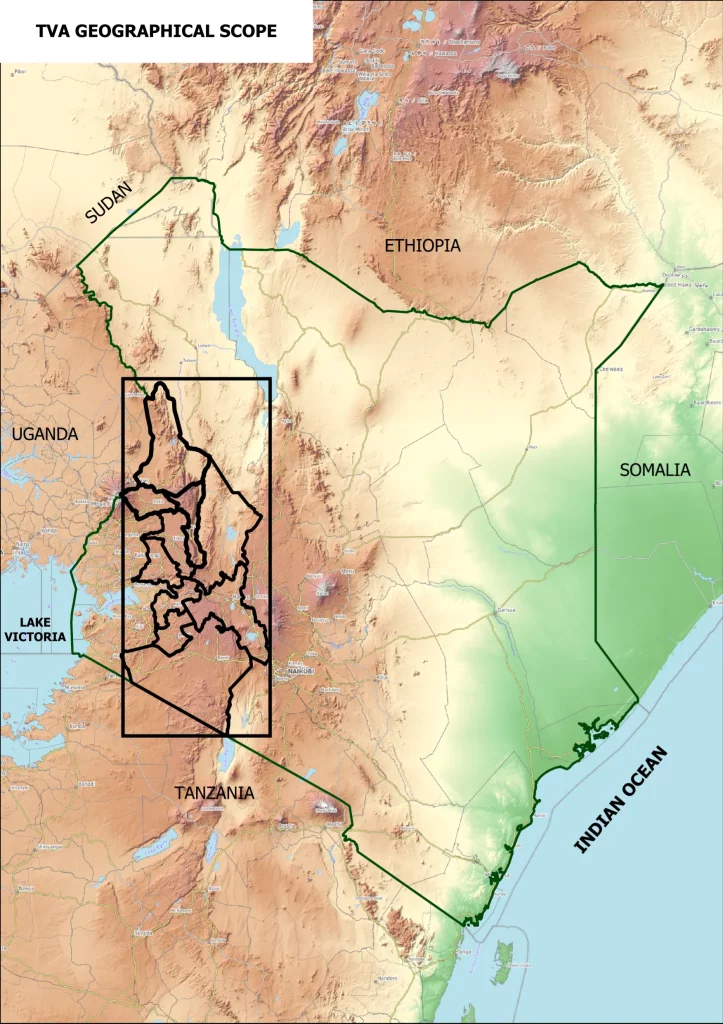
TVA Geographical Scope
Black-bordered regions define the TVA Geographical Scope—a strategic area covering the Turkwel and Kerio river basins where the authority coordinates water security, hydroelectric power, and sustainable development for local communities.